Zillow reports Home Price Declines in California and Florida
Zillow just released their March 2023 Home Value Index for every metro in America. And there are some very interesting trends we need to go through. Namely: home prices continued their decline in California and on the West Coast more generally.
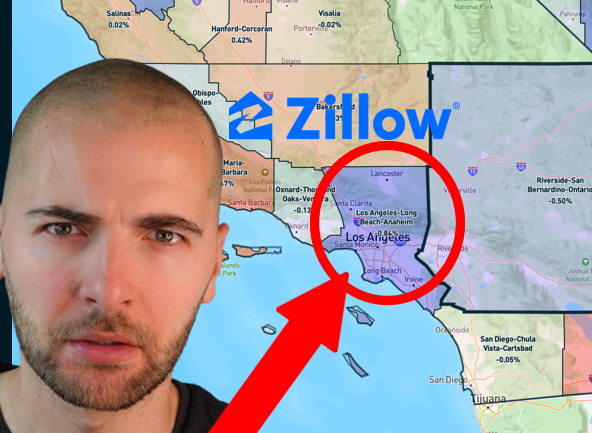
The map below from Reventure App shows the March 2023 Home Price changes color-coded for every metro in America.

Blue = prices dropped in March.
Red = prices increased.
You can see there was a roughly 50/50 split between metros where prices decreased and increased. With California and the West Coast of America covered in blue. The biggest drops on the west coast occurred in San Jose, Los Angeles, and Las Vegas.
Interestingly - Florida also showed up in blue, with values declining marginally across most of the metros in the Sunshine State. The biggest drops occurred in Southwest Florida in areas like Cape Coral and Punta Gorda (-0.60% monthly declines).

Meanwhile, values continued there upward ascent in many Northeast and Midwest metros. Later in this blog post I will show you the Top 10 / Bottom 10 Markets for price declines/increases. But first we need to talk about the national trends.
Home Prices Went UP Nationally
Despite the big variation in where prices went up and down, home prices went up on average across America in March 2023. This marked the first month since Fall 2022 that Zillow reported a monthly increase in home values.
Specifically: Zillow reported that prices went up +0.4% on a seasonally-adjusted basis.

Prices went up in March because there is still a shortage of new seller listings on the US Housing Market. Data from Redfin shows that new listings were down -21% YoY on the month.
The lack of new listings is keeping inventory levels low and returning some pricing power back to sellers. However, we're still a far cry from the boom times of the pandemic when March appreciation levels reached +1.4% in 2021 and +2.0% in 2022.
Altogether - this was a fairly "normal" March for home price growth in the US Housing Market. Similar to what occurred in 2018 and 2019.
Top 10 Markets with Price Declines
Where were the Top 10 Cities with the biggest price declines in March 2023?
You can use Reventure App to see.
Go to "Select Data Point" and hit Home Value Growth MoM.

Next, if you're on desktop, select "Table View" (unfortunately Table View is not available on mobile yet. But it will be soon).
And you will see a list of the markets with the Biggest Increase in home prices. Then click the variable name to reverse sort the list to see the Biggest Declines.

San Jose, CA comes in at #1 for biggest losers, with a -1.27% seasonally-adjusted decline in home prices in March.
A bunch of smaller metros like Beckley, WV and Breckenridge, CO show up with some fairly sizable monthly declines.
Los Angeles, CA registered a -0.84% decline on the month in seasonally-adjusted terms.
Las Vegas, NV was down -0.69%.
Austin, TX was down -0.66%.
Top 10 Markets with Price Increases
Now how about the markets where prices went up the most in March?
Clicking the sort button again allows you to flip the list back to biggest price increases. I also decided to filter the list to only metros with a population above 250,000.

The markets where prices went up the most are smaller metros across the South. Plus some Northeast Rust Belt Areas. Places like Shreveport, LA, Kingsport, TN, Scranton, PA, Greensboro, NC, Chattanooga, TN, and College Station, TX had the most price growth.
The consistent theme among all these metros is affordability. If you look at the Home Value column in the table above, you can see the highest priced market is Trenton, NJ at a $346k typical value, which is right around the US average.
Meanwhile, half of the highest appreciation markets had a typical value below $200k.
Clearly, these markets are still cheap enough to entice homebuyers to buy. Even in the beginning stages of a Recession with Mortgage Rates at 6.5%.
Beware of the "Seasonal Adjustment"
An important point to note is that Zillow's home value indicator is seasonally-adjusted. Meaning that it smooths out month-to-month home price changes based on the seasonal trends in the market.
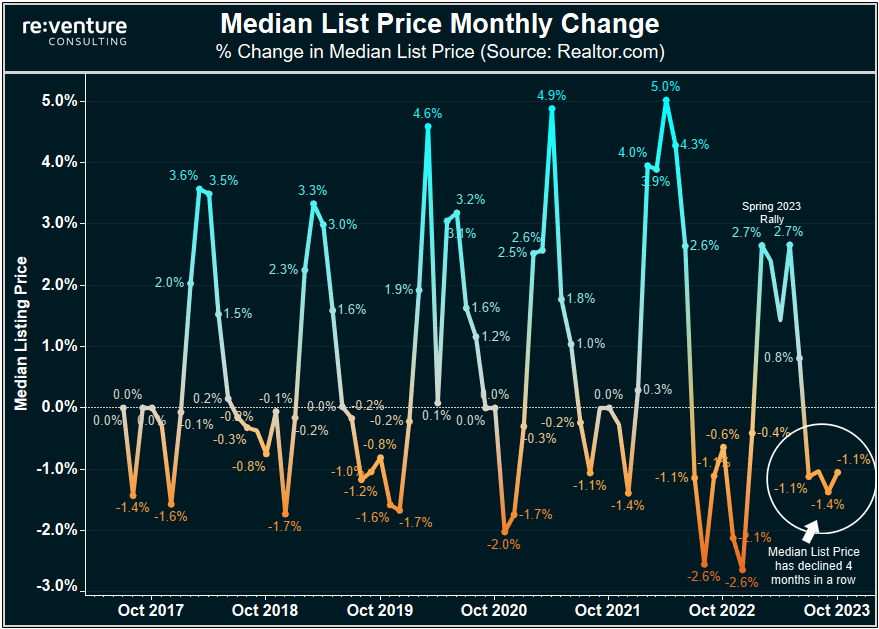
You can see this evidenced on the graph below.
Which compares the Seasonally-Adjusted monthly % change (blue) to the Raw, Non-Seasonally Adjusted % change (orange).

You can see that there is much more volatility in the Raw data, which shows bigger increases in home prices in the Spring, and bigger drops in the Fall/Winter.
The raw data shows a +0.9% increase in March 2023. Which is more than the seasonally-adjusted increase of +0.4%. This comes after a bunch of months in late 2022 where the raw prices dropped by much more than the seasonally-adjusted prices.
The seasonally-adjusted data from Zillow smooths the volatility out. And is the best data point to use to understand the true trend in prices. But beware that in the short-term, over one or two months, it might show changes in prices that are muted compared to what you are observing in the market.
Is the Housing Crash over since Home Prices increased in March?
March 2023 broke the streak of monthly home price declines. Does that mean that the Housing Crash is over?
Well - it depends on who you ask. A realtor or investor will probably say "yes, the boom is back!"
Meanwhile a Housing Market Realist such as myself will say "no, the fundamentals haven't changed. People still can't afford houses".
But rather than debate opinion, I think it's best if we go back to the last Housing Crash from 2006-2012 to see how price trends looked in the beginning stages of that downturn.

You can see that there were still seasonal periods of home price appreciation in mid-2006 and mid-2007 during the initial stages of the last Housing Downturn. It wasn't until 2008 where s*** really hit the fan and where prices declined by a lot.
Why did prices drop a lot in 2008? Because that's when the job losses in America started to mount. Unemployment claims started spiking in Spring 2008, causing a raft of forced sales onto the market which dragged prices down the entire year. (Interestingly - the foreclosures didn't really start hitting until 2009 and 2010.)
All this is to say - one month, or even several months, of price growth wouldn't mean the 2022-2023 Housing Crash is over. Prices are still extremely overvalued, and Americans legitimately cannot afford or qualify for home purchases.
However, I will say this: so long as the unemployment rate stays below 4%, the market will likely trade sideways. Sellers in this market are proving to be very stubborn, and it will take some distress to get them off the sidelines. The distress will come once the unemployment rate starts going up meaningfully.
Where will Home Prices go in April and May?
I suspect home prices nationally will continue increasing in April and May as we're still early in the spring selling season.
I also wouldn't be surprised if we see prices in California start to register positive increases for several months given how much inventory has dropped recently (partially due to the California Dream for All Program, which gave buyers free money to buy a house).
Florida is an interesting one. Inventory is up by a lot YoY across most of the state. Rents are also stagnating or declining in most Florida cities. This suggests to me that the migration train into the state has slowed considerably. However, I keep hearing anecdotal reports of crazy bidding wars. So we'll have to monitor the direction of prices in Florida in coming months.
On a national level: by June and July, we should begin to see more sellers cut the price. Particularly ones who have had houses sitting.
What does Reventure App show as the monthly % change in home prices in your market in March 2023?
Let me know what the price growth is in your market in the comments below. The Home Value Data is also available County/ZIP Code Levels.
-Nick

Comments ()