Home Prices are going down again
The median list price for homes declined by -1.1% in July 2023 according to data from Realtor.com. A welcome sign of relief for homebuyers and real estate investors. But will prices keep declining throughout the rest of 2023?

We have some good news to report on the Housing Market.
Home prices, after going up briefly in the spring, are now officially on the decline once again this summer, with new data from Realtor.com showing that:
- The Median List Price declined in July 2023, indicating that new sellers coming to the market are getting more realistic with their price expectations.
- The share of Sellers Cutting the Price also increased in July 2023, indicating sellers who have stale listings on the market are becoming more inclined to reduce the price.
This is great news for would-be homebuyers and investors as it signals a shift back to more favorable buying conditions. A trend that I suspect will continue over the next several months as we head into the fall.
Sellers cut the price on 21% of all listings in July
One of the key metrics I look at to track the vitals of the US Housing Market is the share of Sellers Cutting the Price, or Price Cut Share. This metric is a very simple calculation, dividing the number of sellers who reduced the price in a given month by the number of total listings in the month.
I've found the resulting percentage to be a great indication of how desperate sellers are to unload houses and as a signal of future home price declines. The good news in July 2023 was that the Price Cut Share increased to 21.1%, down from a low of 16.8% in April.

It's likely that we will see more price cuts hit the market in the coming months due to 1) normal seasonal trends and 2) increased seller desperation as buyer demand dissipates further. It is common to see more sellers cut the price in late summer and early fall since some of them have had their listings on the market since March or April and want to unload them before the winter.
The trouble for these sellers is that homebuyer demand is tanking right now, with mortgage applications to buy a house plummeting back down to near the lowest level in 20 years. Don't be surprised if the normal seasonal price cuts we see in the coming months get very aggressive, similar to what happened last year around this time.
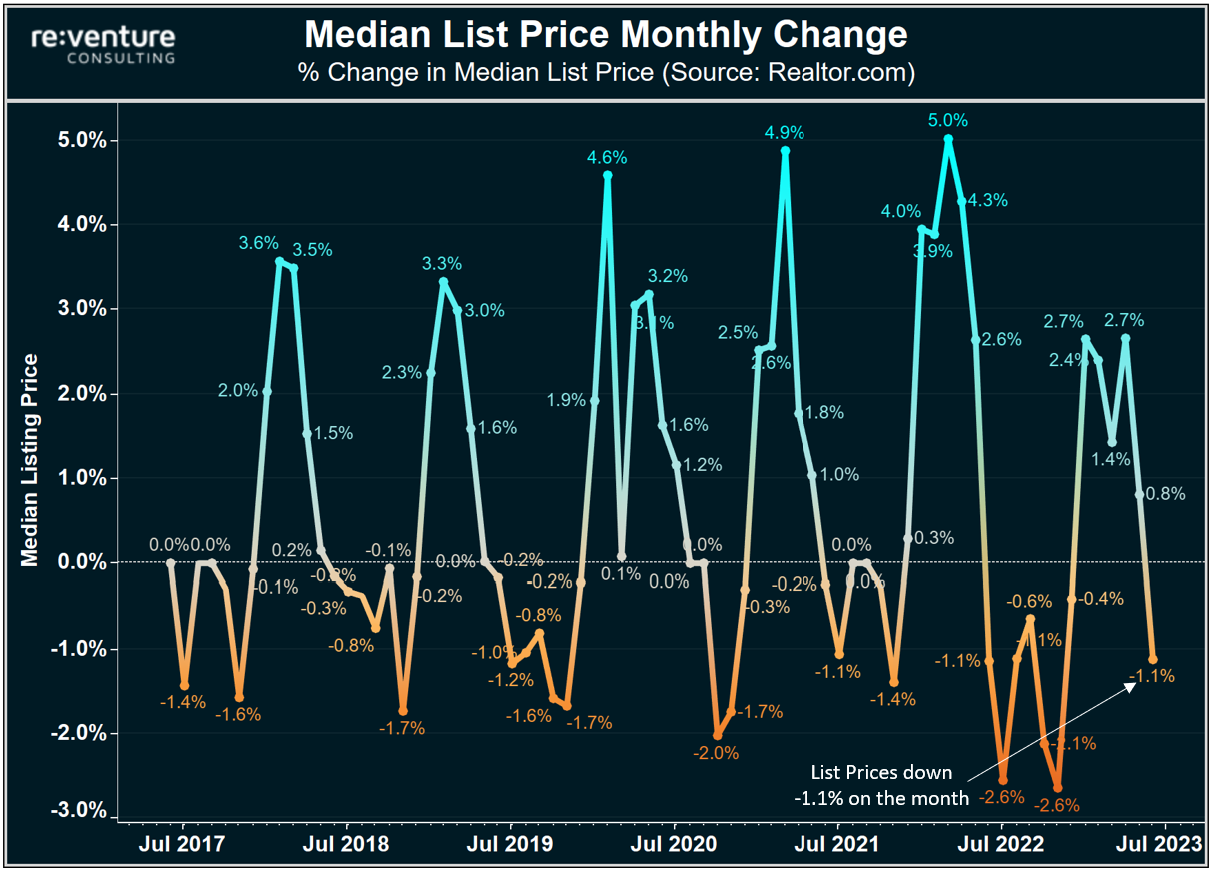
Median List Price down -1.1% on the month
While Price Cut Share is mostly a reflection of the desperation of sellers with stale listings on the market, Median List Price tracks what new sellers to the market are thinking.
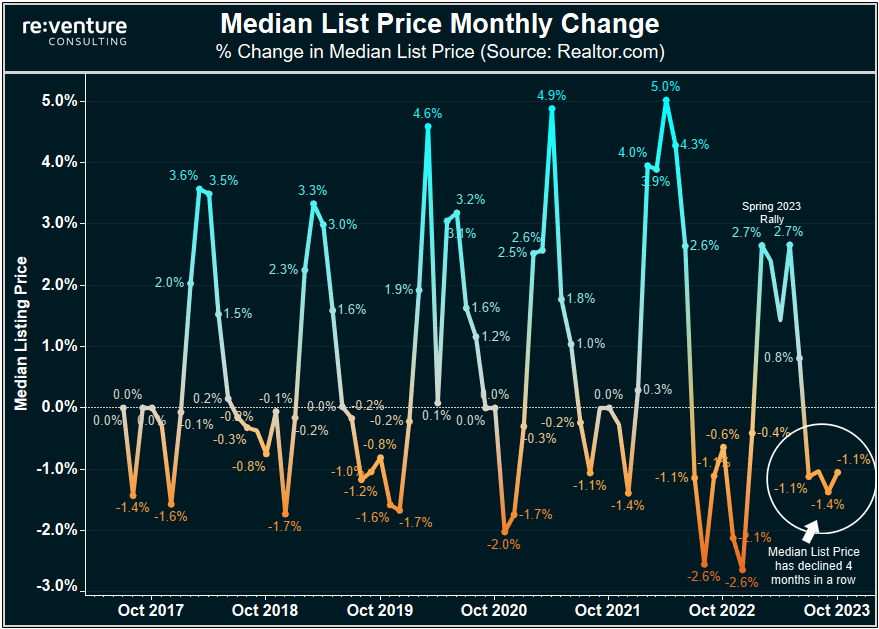
And this data from Realtor.com shows that new sellers are getting a tad more realistic on their initial list price, with a decline of -1.1% occurring on the month. This matches the decline in list prices that occurred last year, in July 2022, when the Housing Downturn got started.

This graph also highlights the clear seasonal trend that occurs in the US Housing Market, where list prices always go up in the spring, and always go down in the late summer and fall.
What's amusing to me is that many Housing Market prognosticators seem to have forgotten this fact, and as a result, they interpreted the price increases that occurred in February through June 2023 as some type of indication of structural improvement in the Housing Market. When it's looking more and more likely that it was normal seasonality at play.
Where do Home Prices go in the rest of 2023?
This all begs the question: where do home prices go from here? Will we see a second half of 2023 that looks similar to the second half of 2022, where sellers were very aggressive in cutting the price?
My answer is that it depends on the market. In some metros, the build-up of inventory and stale listings on the market, combined with high levels of overvaluation, means that we will likely see sellers be forced to cut the price by a lot in the next four to five months to capture a buyer.
If you want an indication of which markets will see the steepest cuts, look at this map below, which I created on Reventure App. I used the filters section on the left to isolate metros with high inventory growth YoY (+25%), days on the market growth YoY (+25%), and heavy overvaluation (at least 20% overvalued).
This is the cocktail for home price declines.

You can see a pretty clear trend: Housing Markets across the South and parts of the Mountain region are in the crosshairs. Particularly in states like Florida, Georgia, Tennessee, and Texas. Many of these areas boomed during the pandemic and are now dealing with a slowdown in buyers to go along with a big surge in home building that has increased supply.
Note: I think prices will decline across America more broadly as the year progresses. But I suspect it will be these markets that get hit hardest.
Are you seeing Price Cuts in your Market?
But I want to hear your feedback: are you seeing lower list prices and more reductions in your local housing market? Does the data on Reventure App match what you are seeing when you search on Zillow or Redfin?
You guys are my eyes and ears on the ground of the US Housing Market. Let me know in the comments below and be sure to mention what metro or state you're looking in.
-Nick


Comments ()